Annual Reports
Chevalier International Holdings Limited's annual reports contain management's most considered account of the business. These are the sections, passages and visual pages worth opening in the originals preserved in Sources.
Chevalier International Holdings — FY2025/26 Annual Report — FY2026 (year ended 31 March 2026)
Latest report; documents a turnaround to HK$473m profit after a HK$503m loss, with a Canada car-dealership exit and US senior-housing disposals. · Open the full document →
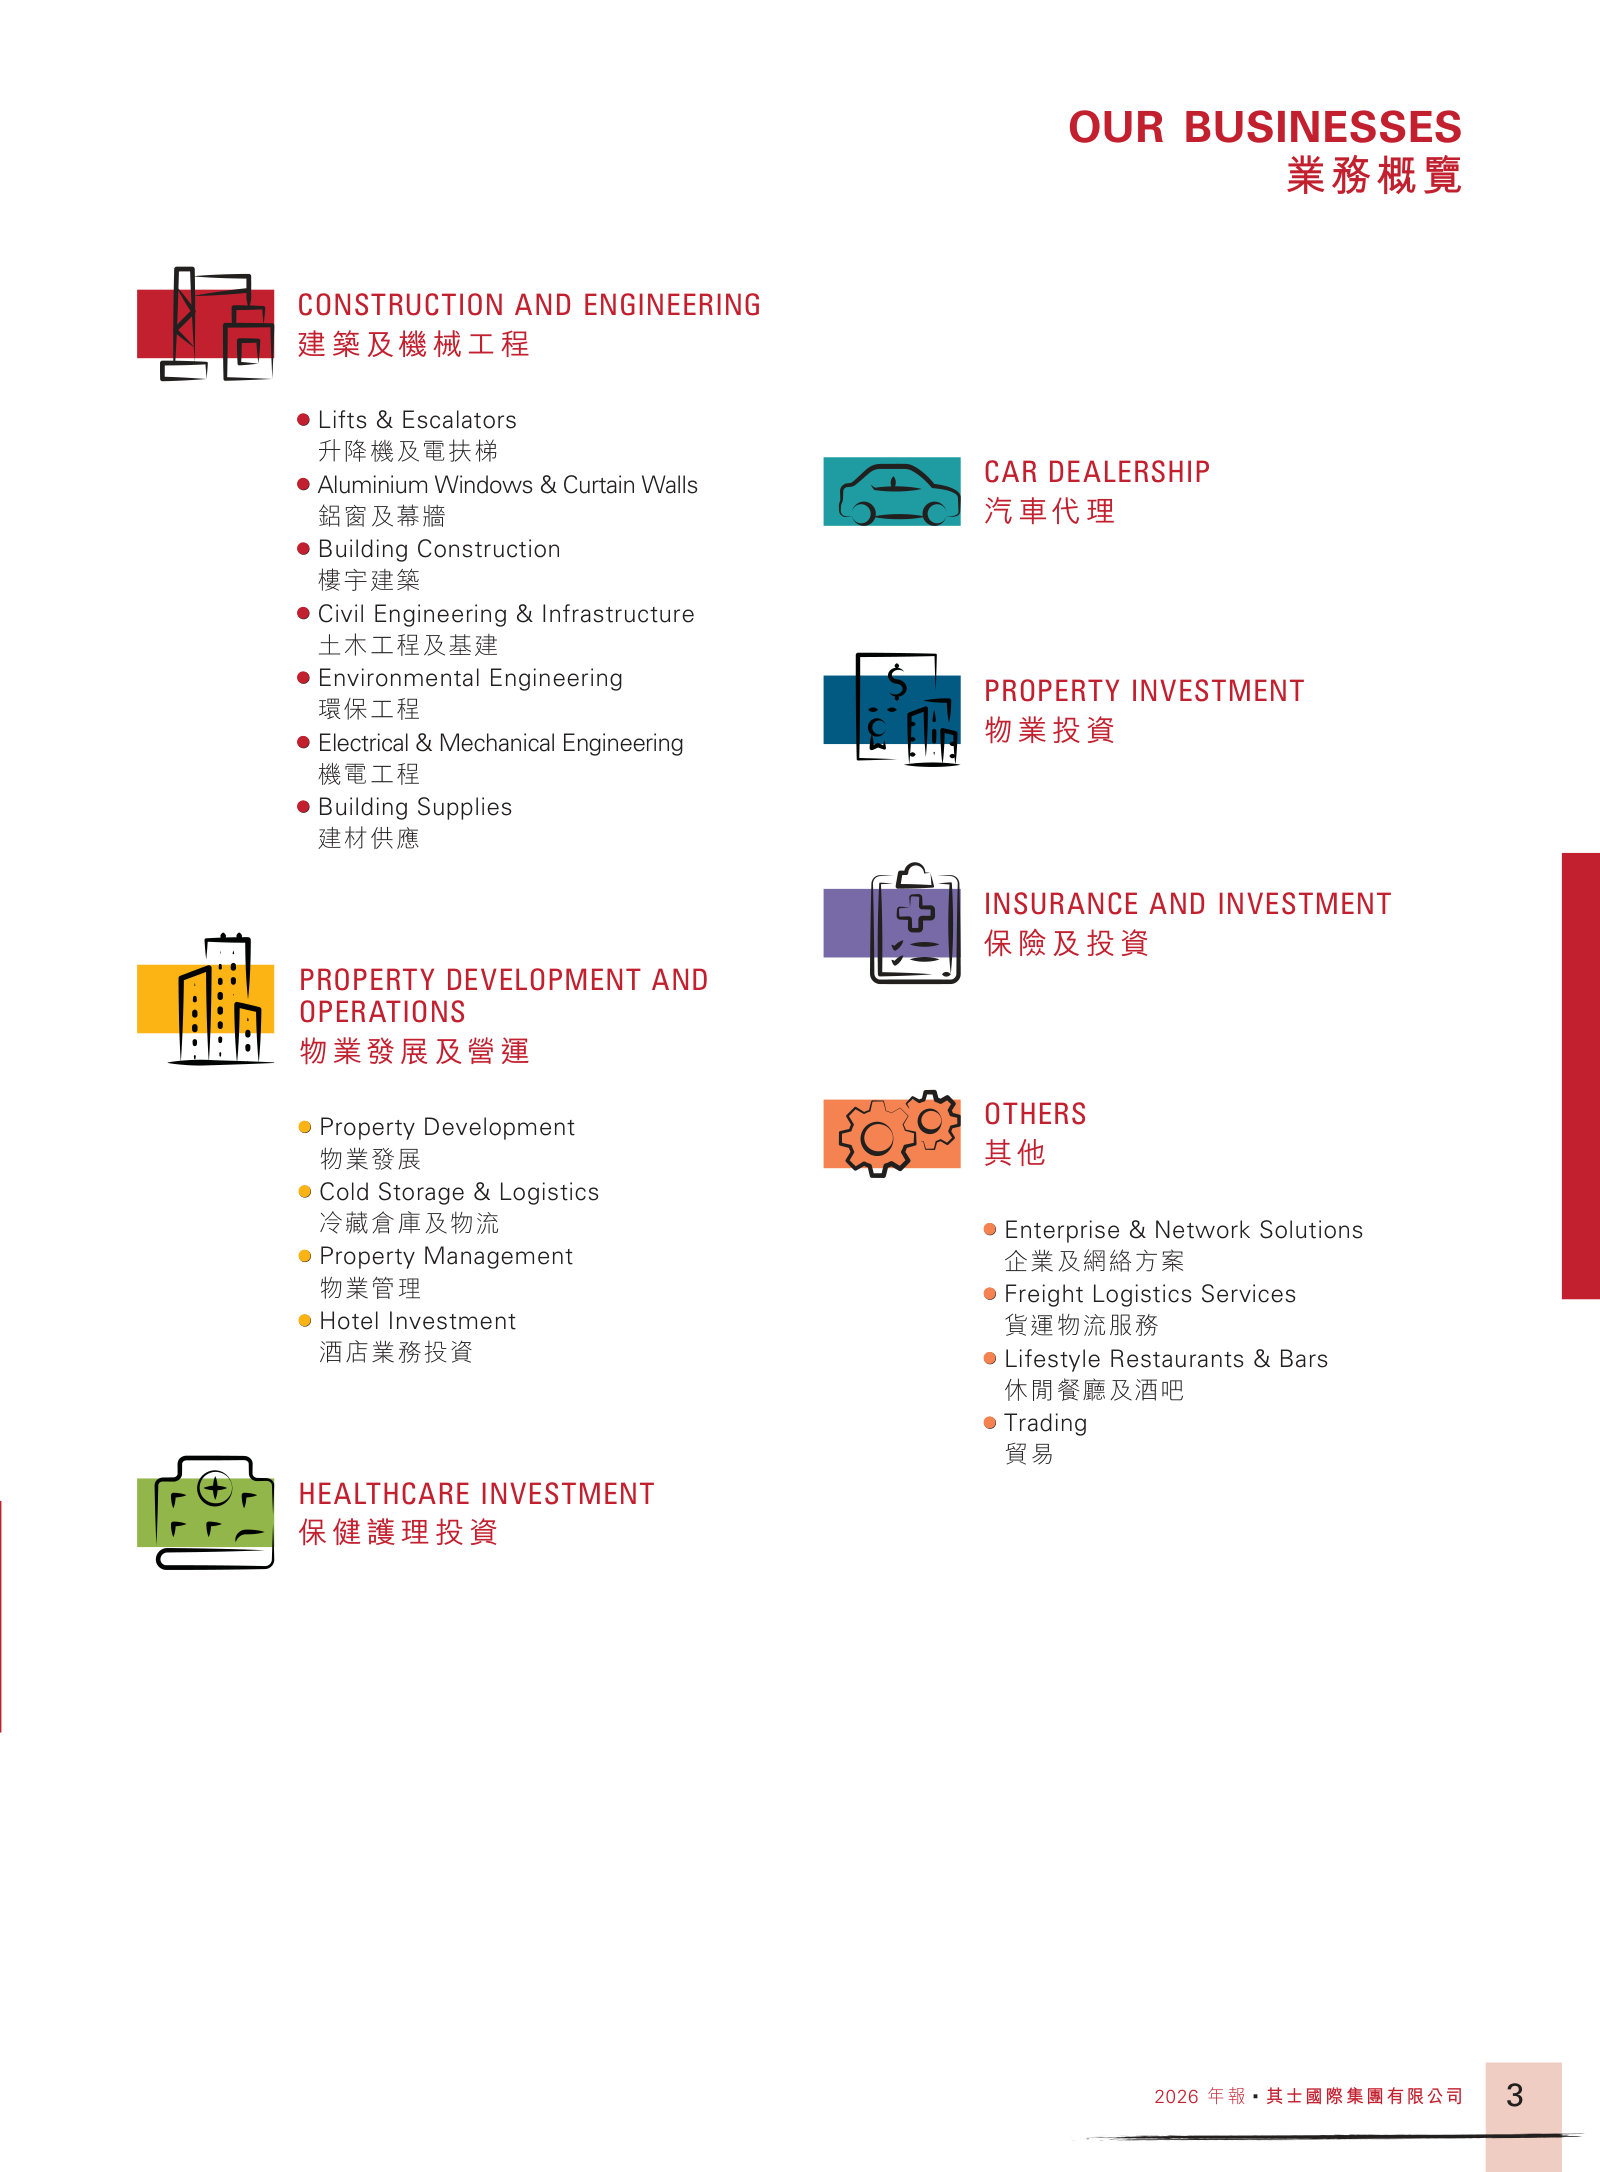
Business Segments Overview — p. 4 · Read the full section →
One-page map of the seven businesses that make Chevalier a conglomerate — the anchor for reading everything that follows.
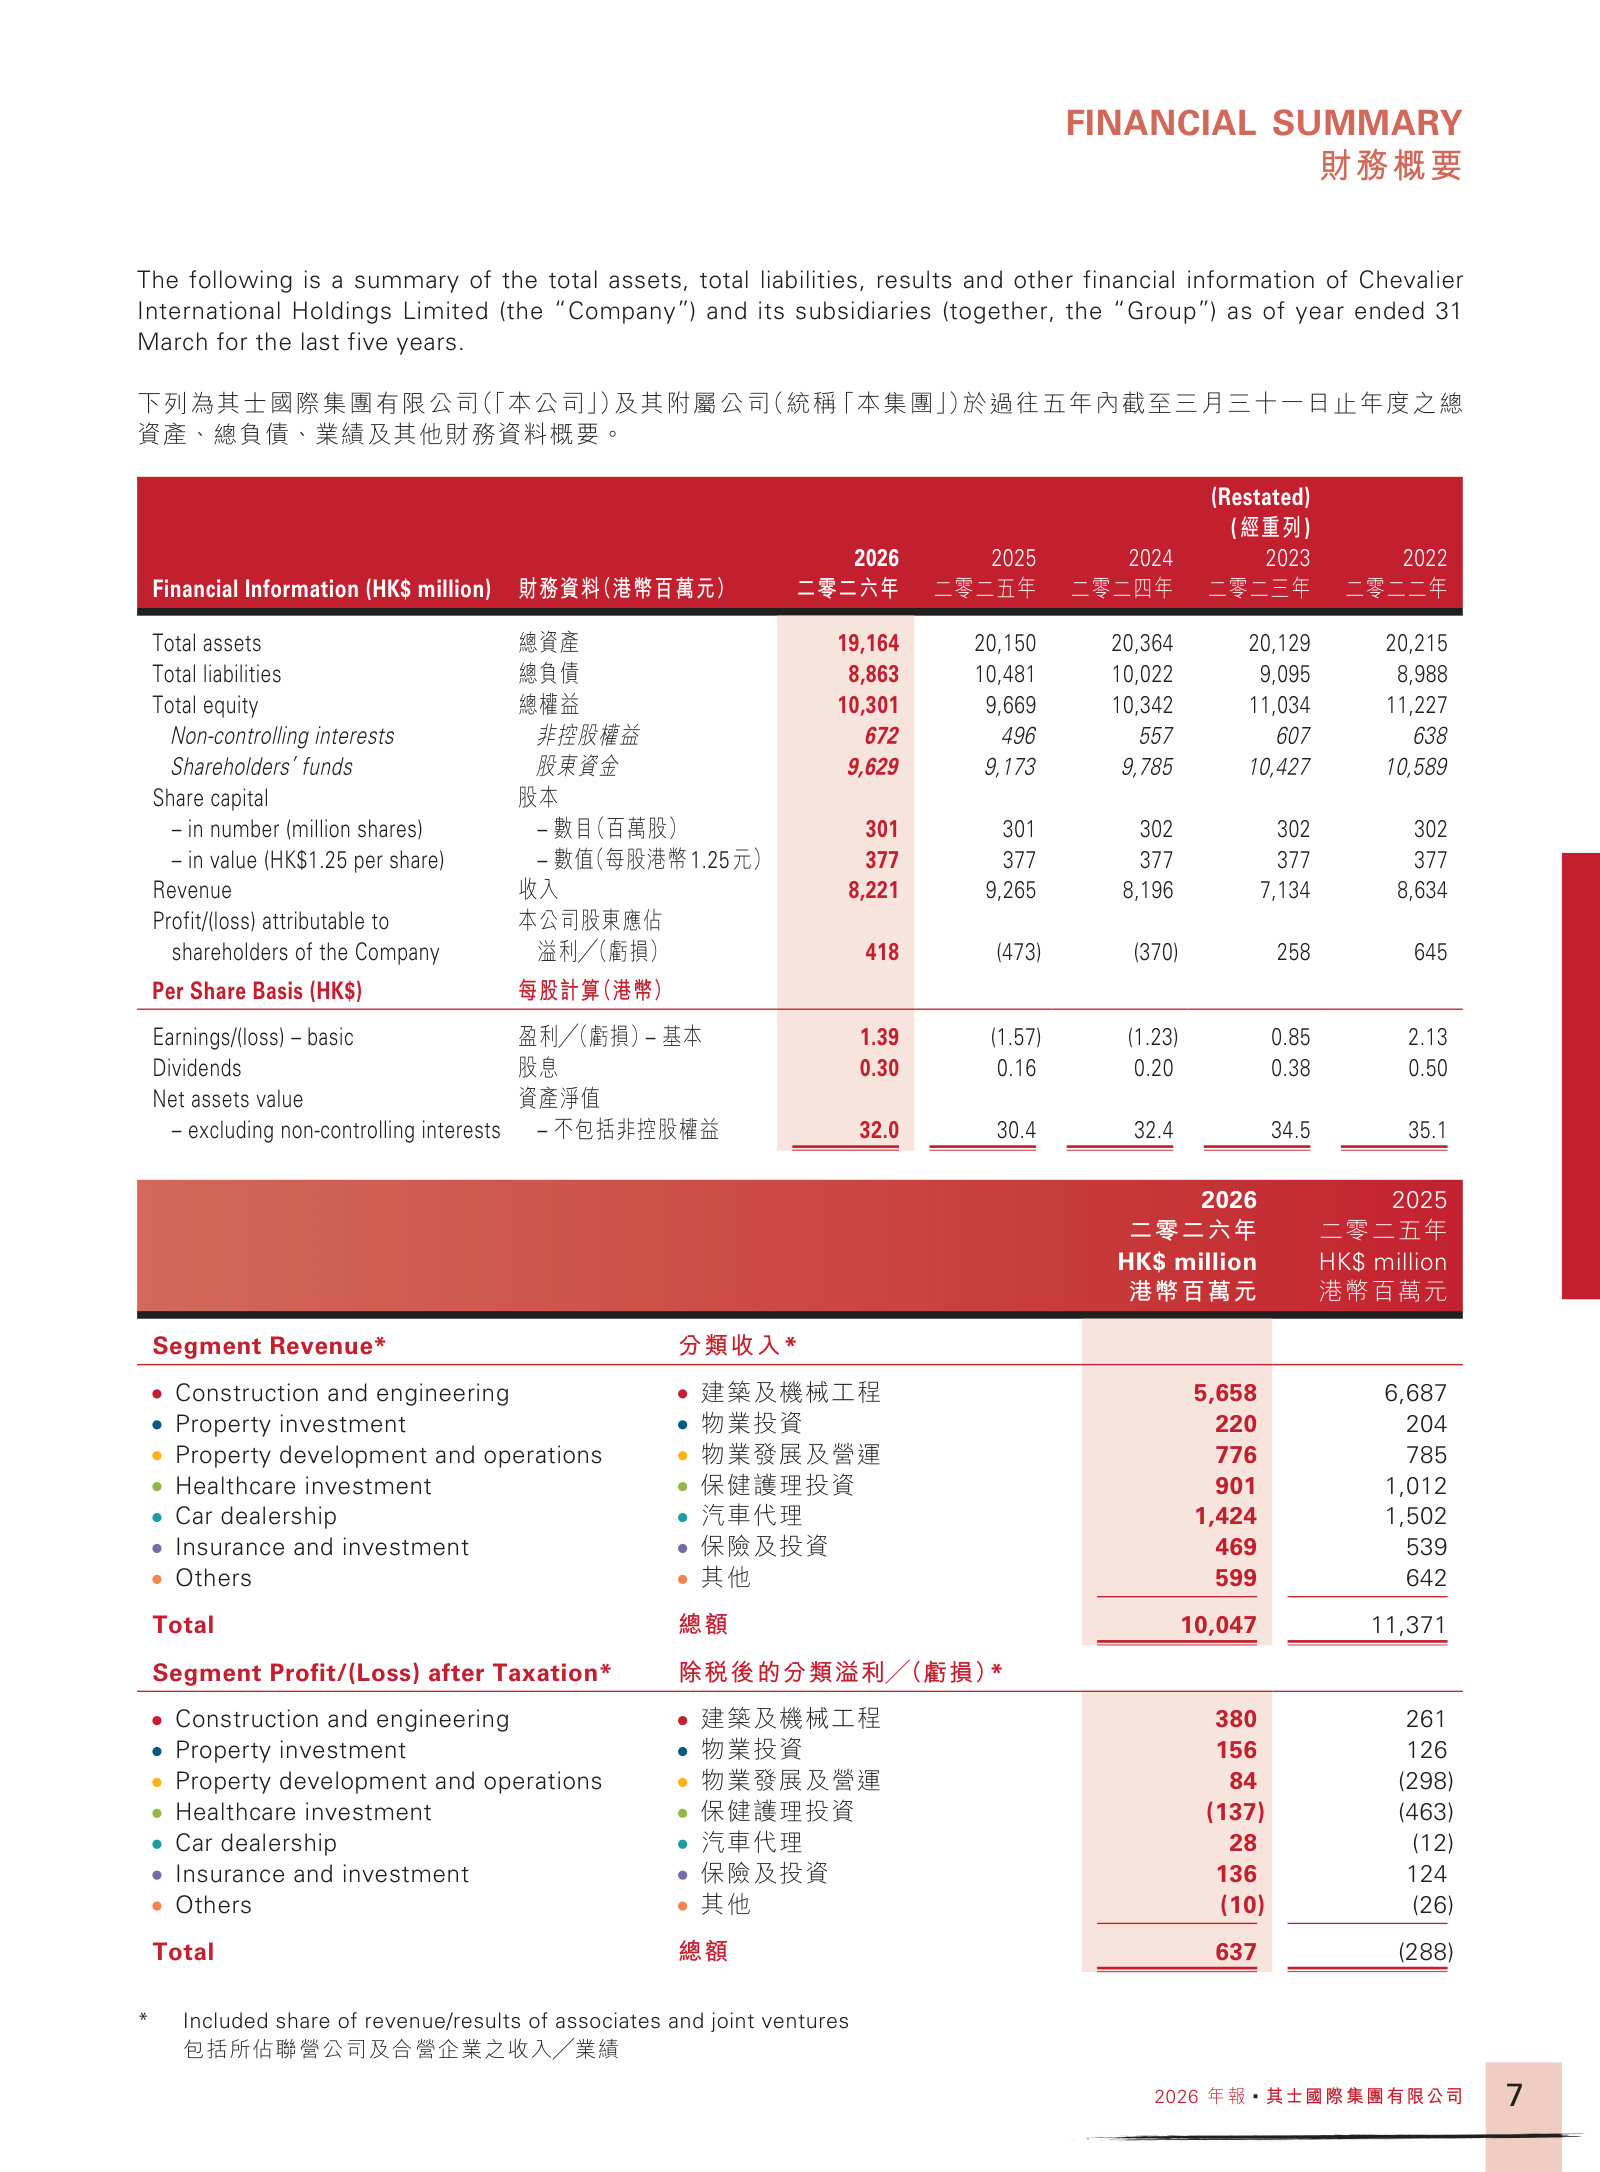
Financial Summary — Five-Year Record — p. 5 · Read the full section →
Shows how flat revenue masks a swing from two loss years back to profit; the five-year table sets the base rates.
FY2026 headline metrics: revenue down 11%, but profit swings positive and dividend nearly doubles.
REVENUE
收入
HK$ 港幣
8,221 million 百萬元
11.3% Decrease from 2025
p. 5 · Read in context →
Management Discussion and Analysis — p. 16 · Read the full section →
Management's own account of the turnaround — the five drivers that flipped a HK$503m loss to a HK$473m profit.
The turnaround, in management's words: five drivers behind the return to profit.
The consolidated results recorded a substantial turnaround, mainly attributable to (i) improved contribution from the construction and engineering segment; (ii) gains on disposal of properties located in Canada and the US; (iii) significant reduction in the net fair value loss on investments at fair value through profit or loss; (iv) a reduction in the provision recognised on properties under development; and (v) a reduction in the provision on properties for sale to net realisable value.
p. 16 · Read in context →
Construction & engineering — the largest segment: revenue fell but profit rose on cost savings.
The Construction and Engineering segment recorded revenue of HK$5,658 million for the year ended 31 March 2026 (2025: HK$6,687 million). The decline in segment revenue was mainly due to some major projects being substantially completed during the year. Segment profit before net finance costs amounted to HK$421 million (2025: HK$276 million). Significant improvements in segment profit are mainly due to cost savings from various completed projects.
p. 16 · Read in context →
MD&A — Car Dealership — p. 23 · Read the full section →
The clearest example of active portfolio pruning: Chevalier exited its loss-making Canadian car-dealership business entirely this year.
Strategic exit from Canada's car business amid narrowing margins and sustained losses.
The automotive market in Canada faced challenges during the year, including rising interest rates and increasing new vehicle prices, which dampened consumer demand. Amid narrowing profit margins and sustained losses in the car dealership segment, the Group strategically exited its car dealership operations during the fiscal year, including related repair and maintenance services, as well as its real estate properties in Ontario, Canada.
p. 23 · Read in context →
Financial Review — Consolidated Income Statement — p. 26 · Read the full section →
Line-by-line bridge of the profit recovery; gross margin nearly doubled even as revenue fell.
Gross margin jumped from 6.9% to 11.0% despite lower revenue.
Gross profit increased from HK$639 million in the year 2024/25 to HK$908 million in the year 2025/26 and gross profit margin increased from 6.9% to 11.0%.
p. 26 · Read in context →
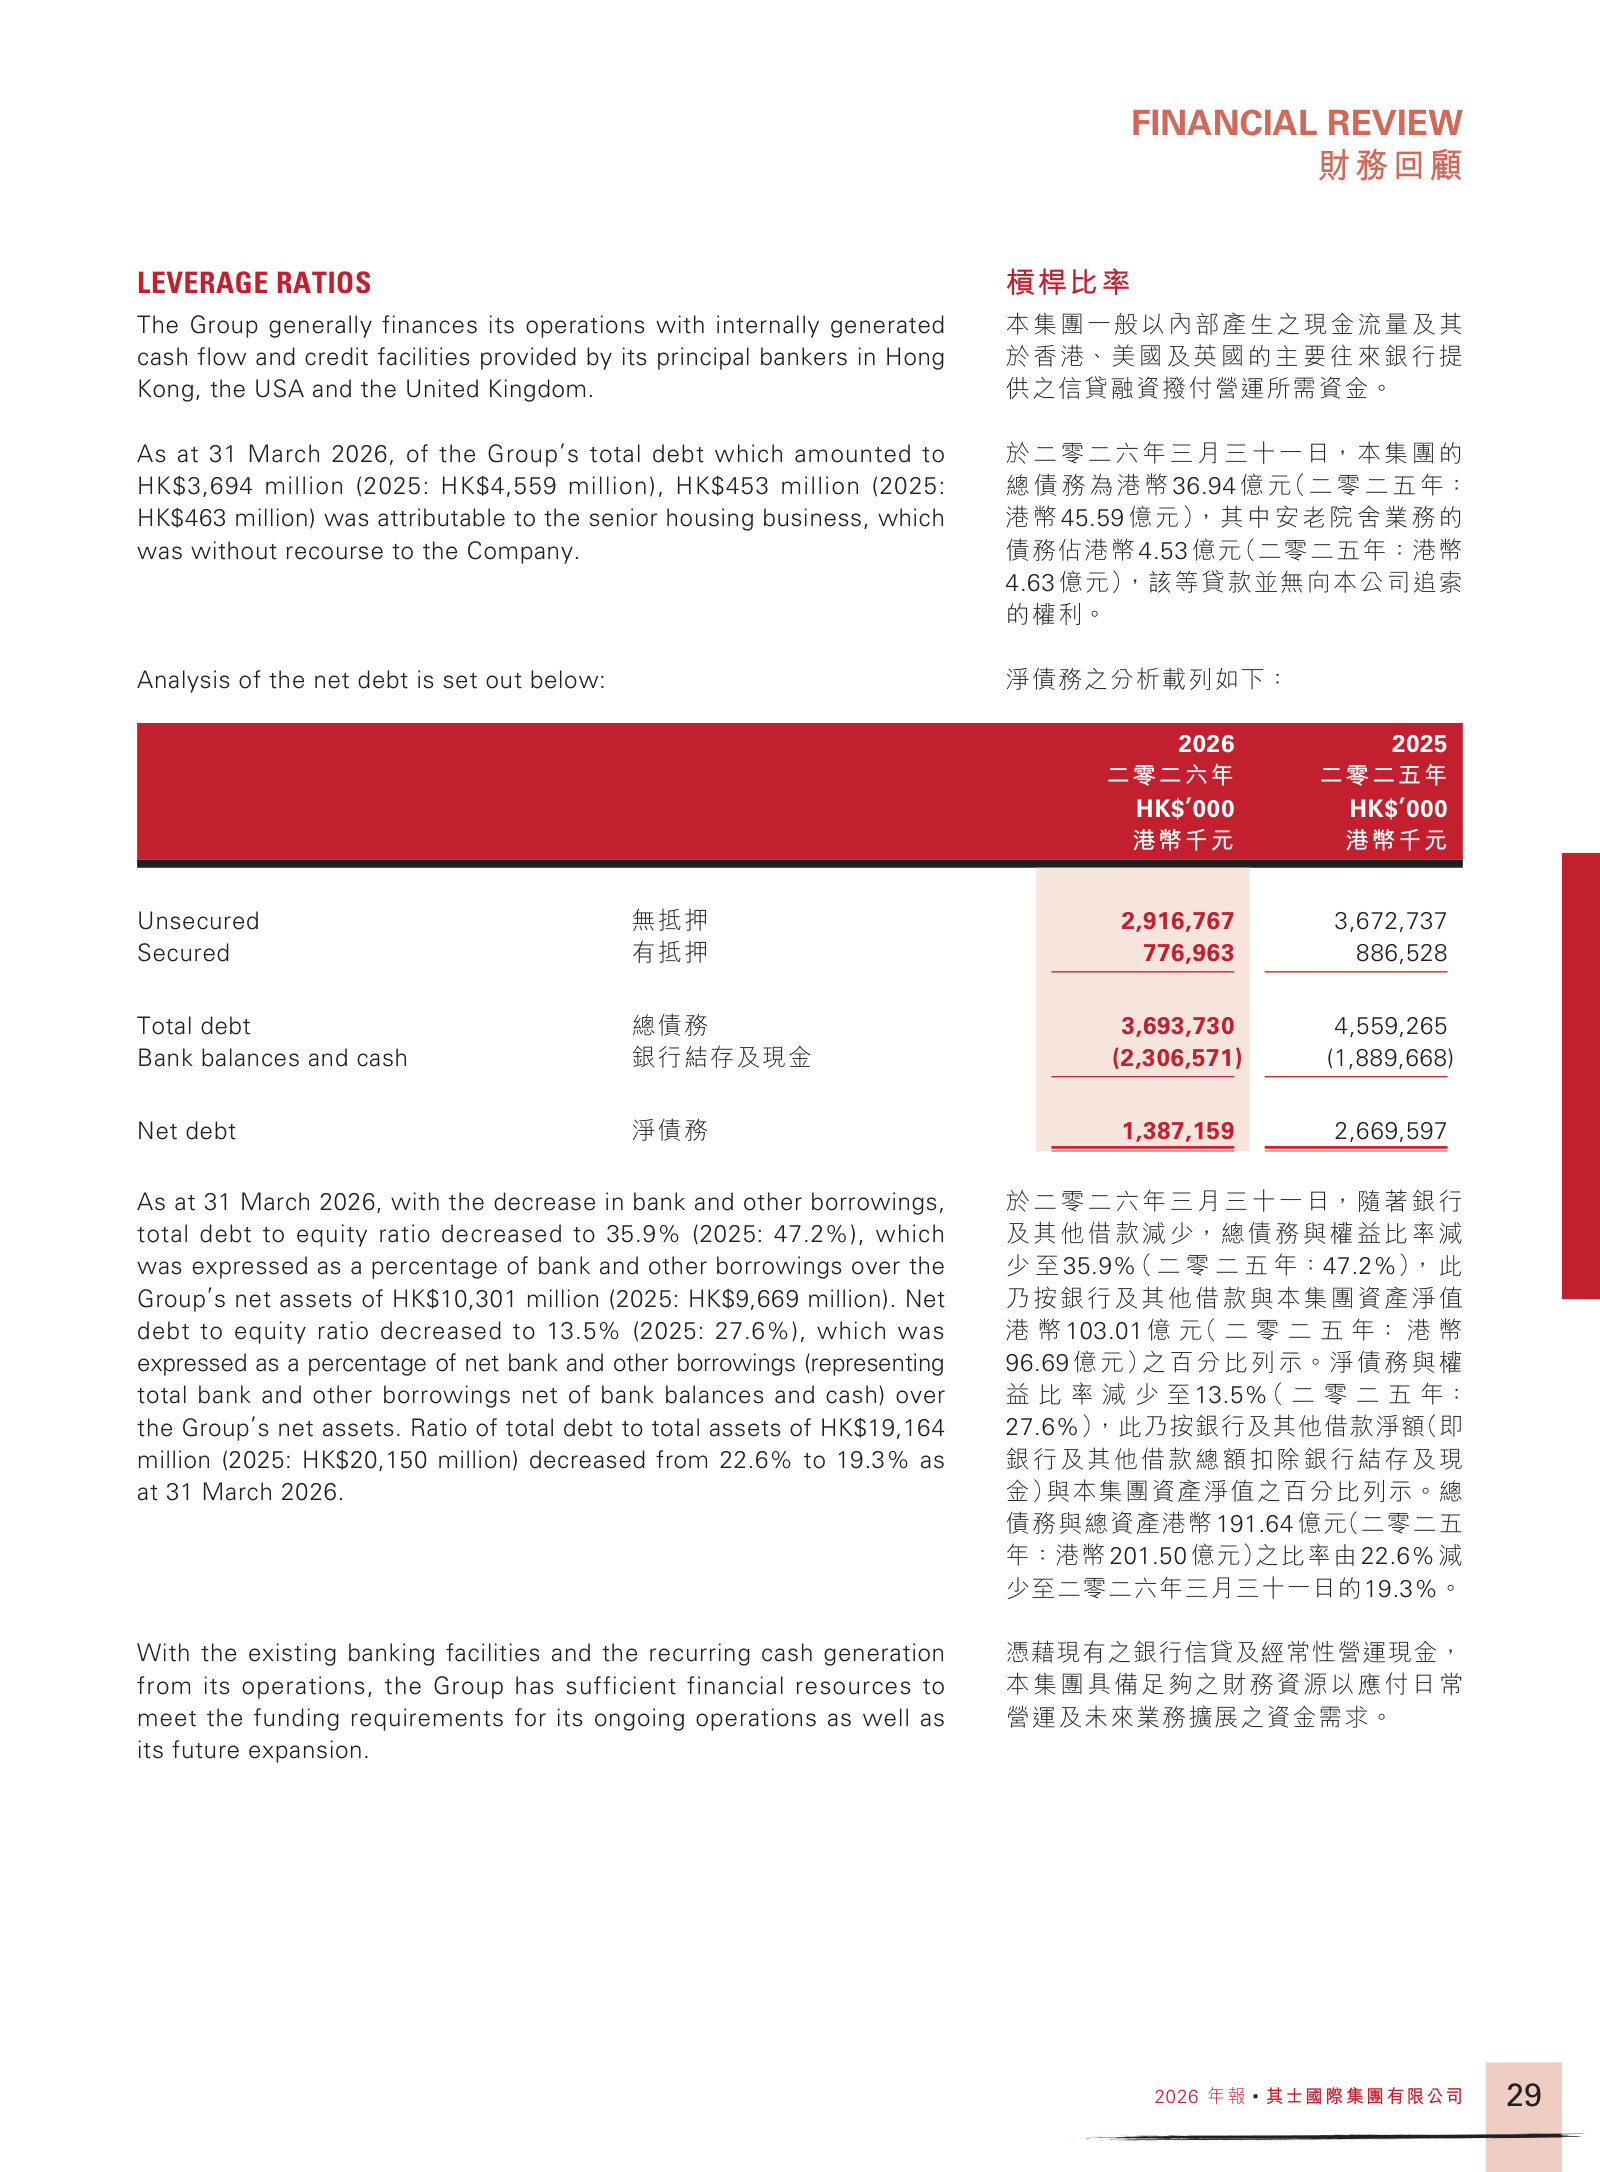
Financial Review — Leverage Ratios — p. 30 · Read the full section →
Debt cut by nearly a fifth; net debt almost halved. Key to the investment case for a leveraged property-and-construction conglomerate.
Independent Auditor's Report — Key Audit Matters — p. 66 · Read the full section →
The auditor flags where judgement most drives the numbers: valuing investment properties and recovering development-property carrying values.
KAM 1 — HK$5,856m of investment properties valued on management's assumptions.
The Group’s investment properties were carried at HK$5,856 million as at 31 March 2026 and a net increase in fair value of HK$72 million was recognised in the consolidated income statement.
p. 66 · Read in context →
KAM 2 — recoverability of HK$766m development properties and HK$710m properties for sale.
The Group had HK$766 million and HK$710 million of properties under development and properties for sale respectively as at 31 March 2026.
p. 68 · Read in context →
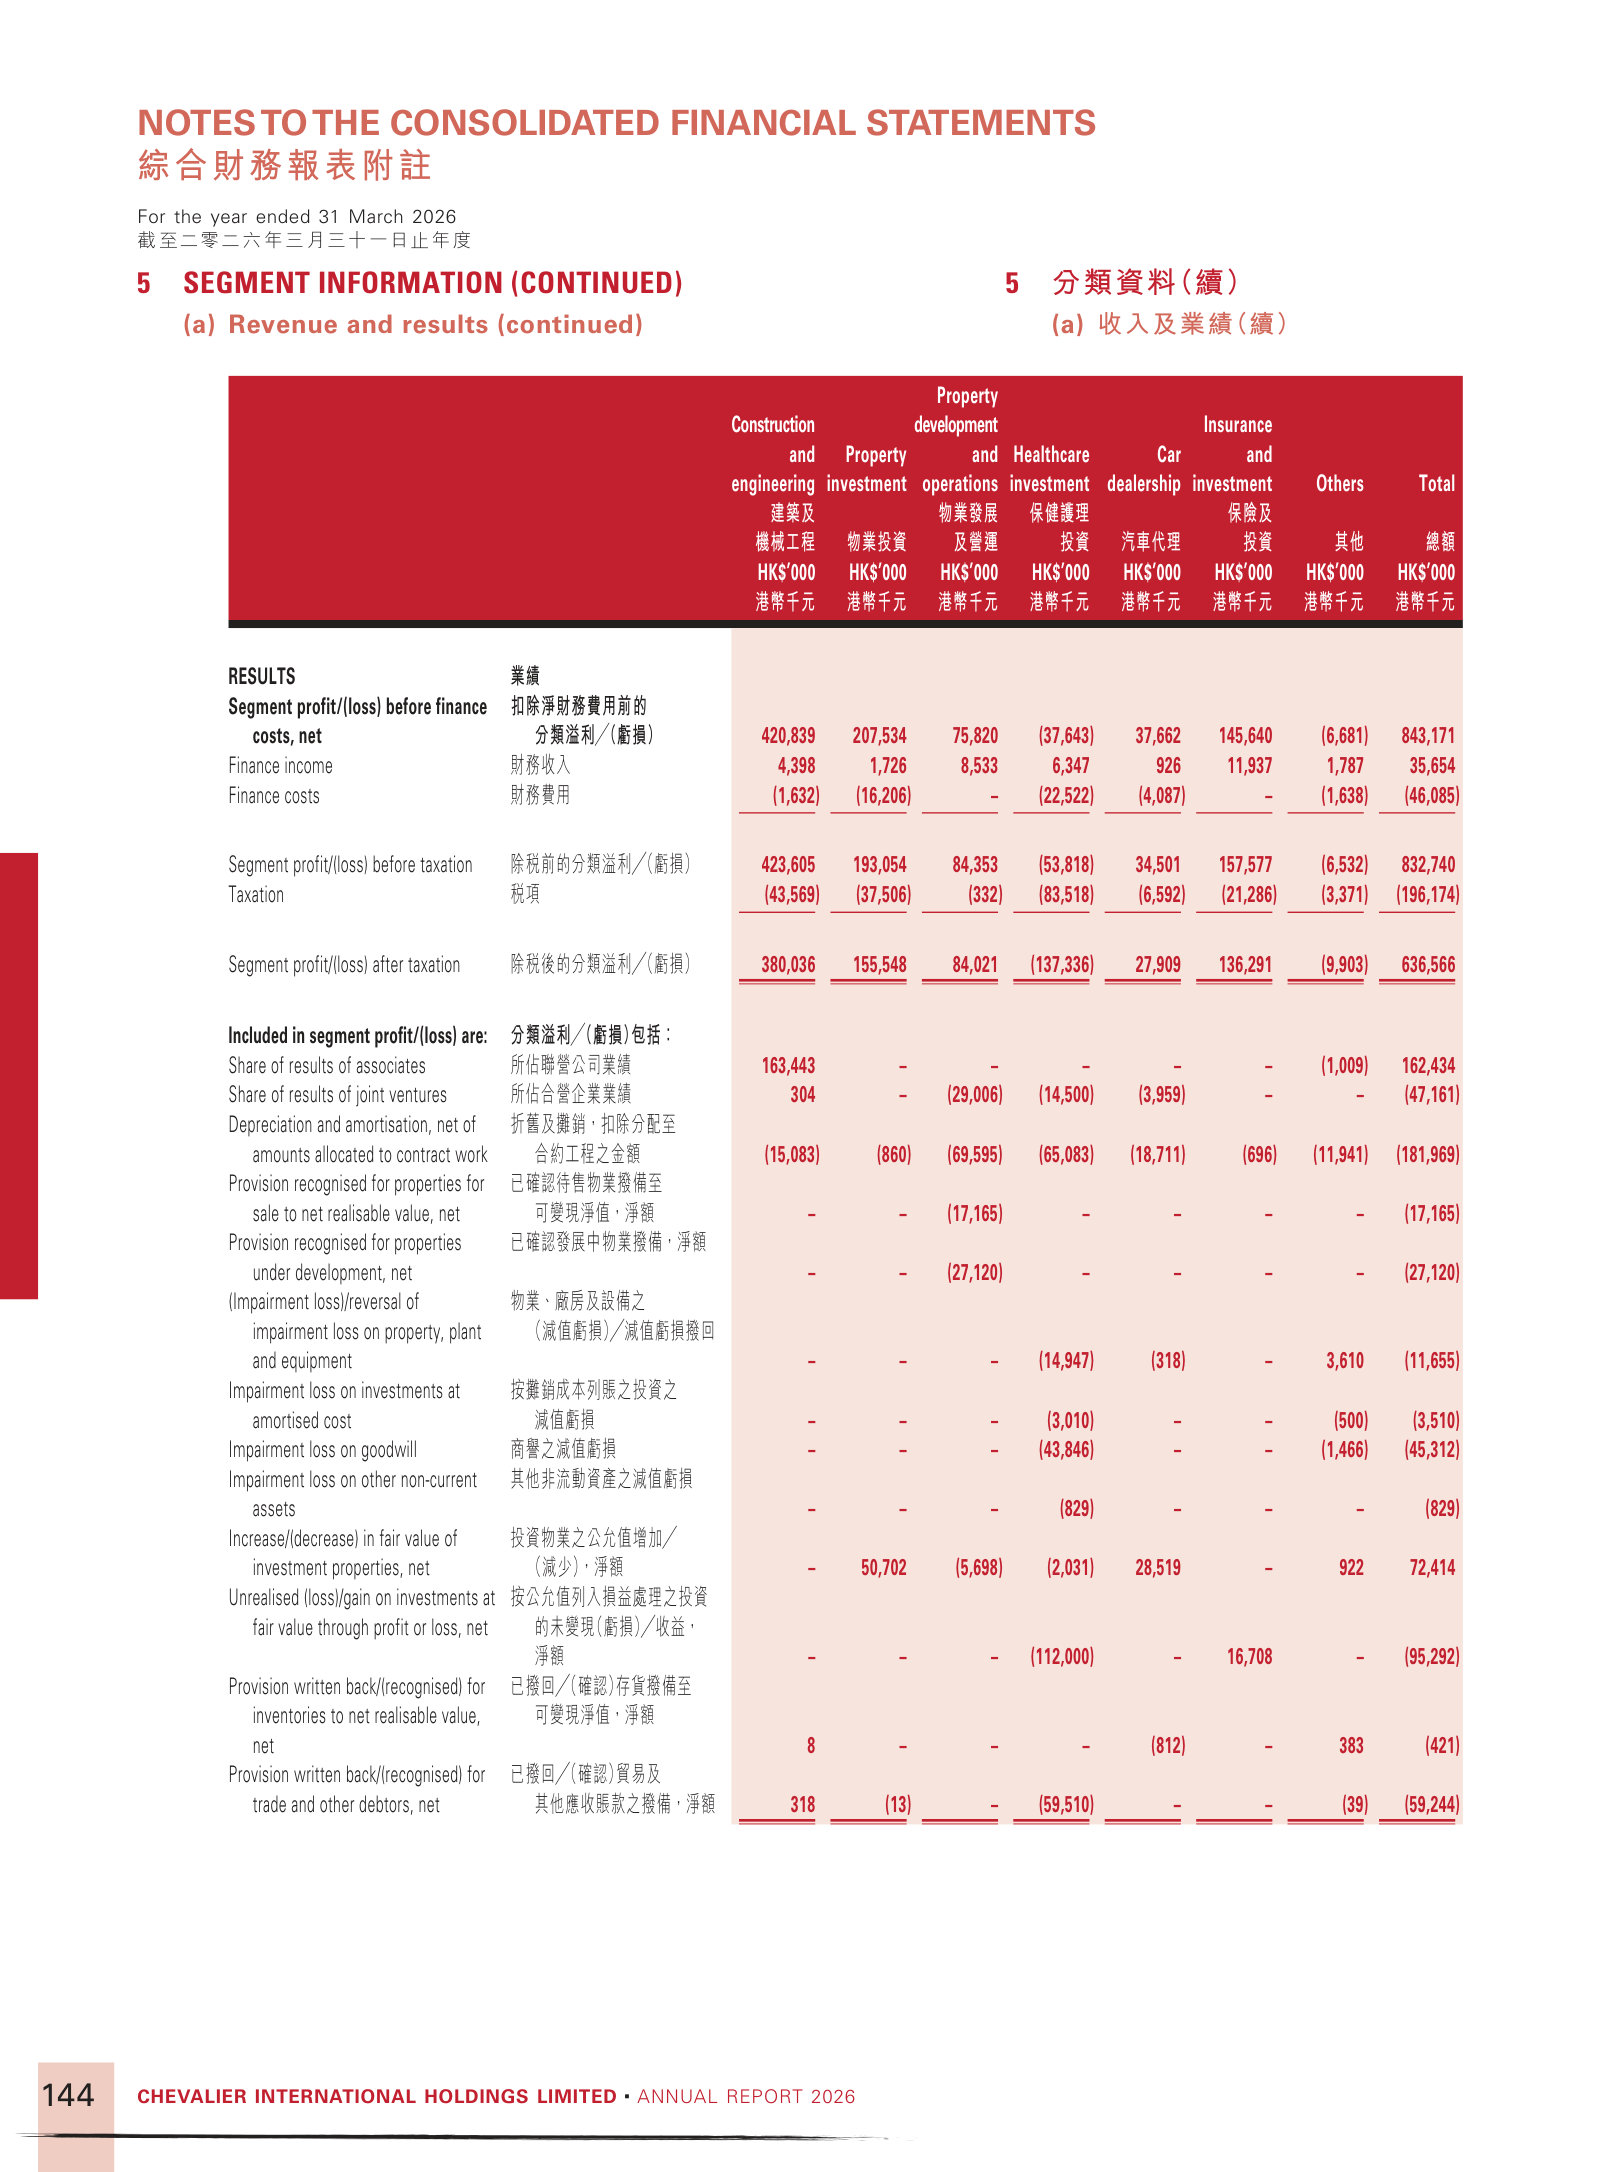
Note 5 — Segment Information — p. 143 · Read the full section →
The audited definition of each segment and its revenue/result split — the ground truth behind the MD&A narrative.
How management draws its segment lines — by product/service, as reviewed by the Directors.
The operating segments are determined based on the reports reviewed by the Directors, the chief operating decision maker, that are used to make strategic decisions. The Directors consider the business from a product/service perspective.
p. 143 · Read in context →
More annual reports
Chevalier International Holdings — FY2024/25 Annual Report — FY2025 (year ended 31 March 2025) · 302 pages · The loss year (HK$503m loss) whose provisions and write-downs set up the FY2026 turnaround; also the fullest standalone ESG report. · Open →
Chevalier International Holdings — FY2023/24 Annual Report — FY2024 (year ended 31 March 2024) · 290 pages · First of the two loss years; useful for tracing when property and healthcare provisions began to bite. · Open →
Chevalier International Holdings — FY2022/23 Annual Report — FY2023 (year ended 31 March 2023) · 246 pages · Last profitable year before the downturn; the FY2023 figures are later restated, so worth comparing against the five-year record. · Open →
Chevalier International Holdings — FY2021/22 Annual Report — FY2022 (year ended 31 March 2022) · 226 pages · Peak-earnings year (EPS HK$2.13, dividend HK$0.50); the high-water mark for the current portfolio. · Open →